Last Updated on January 14, 2025
Welcome to the fundamentals of data tracking training and exam!
This training and exam covers the very basics of the 3 main data tracking tools we use: Google Analytics, Google Search Console, and Google Tag Manager. The purpose of this training is to get you familiar with these tools and how to navigate through their interfaces.
You will take an exam with one the Fulfillment Trainers. Throughout the training, if you have any questions, email one of the trainers (emails found the fulfillment team page) or talk to them in person, or reach out over Google Chat. When you’ve finished the training, feel free to go over the exam and then schedule a time to take the exam with a trainer on Google Calendar.
Data Tracking for Digital Marketing
Data tracking in relation to digital marketing refers to collecting data for our clients’ websites and Google Ads. It is absolutely essential as it tells us the valuable story of where a client’s website or ads started, how their digital marketing efforts are currently going, and what opportunities we might take advantage of.
Google Analytics tells us where users came from and what they do once they get to a website. Did they get to our website from an Ad, Google search result, etc.? Did they do anything on the website such as fill out a form or purchase a product?
Google Search Console tells us how Google sees a website. How often does a website show up in search results? Which queries are we showing up for? Are there any issues with the pages on the website?
Google Tag Manager allows us to collect information that cannot otherwise be collected by Analytics or Search Console.
With this information, we can make informed marketing decisions – but first we need to understand how to access and read the data.
One of the main tools we use for tracking data is Google Analytics.
Watch the introduction video and then explore the Sebo Google Analytics GA4* account.
*You’ll hear us refer to Analytics as GA4 vs. Universal Analytics a lot. Google recently came out with a new version of Google Analytics (GA4) and will be discontinuing the older version (Universal Analytics). Because of this, many of our clients have only recently shifted over to GA4 accounts (since the middle of 2023 at the latest). This training covers only GA4 material.
For more in-depth questions on Google Analytics 4: Get started with the new Google Analytics
Google Analytics: The What, The Why, The How
You can access Google Analytics by visiting analytics.google.com in Sebo’s Agency Gmail account. You can then search for the client’s Analytics account by clicking the dropdown menu in the upper left hand corner. You can either look for the Account & Property from the drop down, or search for the correct Account and Property.
It may be helpful to understand that we have access to multiple client Analytics accounts which contain various Analytics properties.
- Account – The container for each client
- Property – Each data set a client is tracking for their websites.
A client could have a single property for each of their websites, or they could have multiple properties for each website. It just depends on how they are choosing to segment their data. When using Analytics for a task, make sure you are in the correct Analytics Account and Property. If you need help figuring out where you should be, please ask!
Now that you’re inside Sebo’s Analytics account, spend some time exploring the data to get familiar with it. Below are some ways we regularly view data within Analytics. Practice viewing the data in each of these ways and feel free to explore any other sections that are interesting to you.
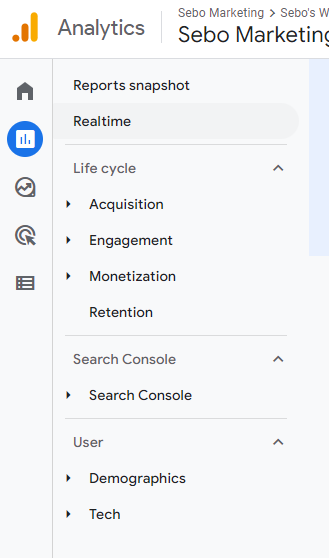
For now we are just going to focus on reading Analytics Data. We’ll focus on the Reports Tab. There are generally 3 sections of reports we are going to spend our time in:
- Life Cycle – data related to where website users are coming from & what they are doing
- Search Console – data related to search phrases that lead to the website
- User – personal data related to website users
Acquisition: Traffic Acquisition
This report tells us how users got to the website as well as some other essential data (see video). It does this by grouping the data into channels.
Some different channel groupings you should be familiar with are:
- Organic Search – visitors that came from an unpaid Google Search result
- Direct – visitors that visited the website by typing the URL into the browser
- Paid – visitors that clicked on an ad
- Referral – visitors that came from another website
- Social – visitors that came from a social media platform
There are other channels, but these are some of the more common ones you might see.
Engagement: Events & Conversions
Events are any actions we can track on a website. Not all events are things that have monetary value but they can still give us valuable insight into actions taken on a website. For example, one event we can track is if someone views a video on a website. Viewing the video doesn’t mean they purchased a product or service; however, if we notice that people who view a certain video are more likely to make a purchase, then we might use that video more strategically on the website. These types of events are micro-conversions. They’re actions that lead to a conversion but aren’t a conversion themselves.
Goals are any trackable behavior a visitor can take that provides value to a client. Often, this value is monetary. For example, if a client has an e-commerce website, then their goals would be products sold. More often than not our clients are selling services and not products. In those cases, we are usually tracking the number of leads the website generates. The main way we track lead goals is through the number of form fills and phone calls the website generates.
Monetization: Ecommerce Purchases
This report shows data related to e-commerce (revenue that comes directly through the website through the sale of goods or services). Most of our clients’ websites are lead based, meaning they are collecting leads through their website, not e-commerce. For the few that are e-commerce sites, this information is useful. Note that you will not be working on e-commerce sites for a while at Sebo, so just know this report exists.
By connecting Search Console to Google Analytics, we can see organic traffic website data based on the keyword that was searched on Google. You’ll learn more about Search Console in the next section of this training.
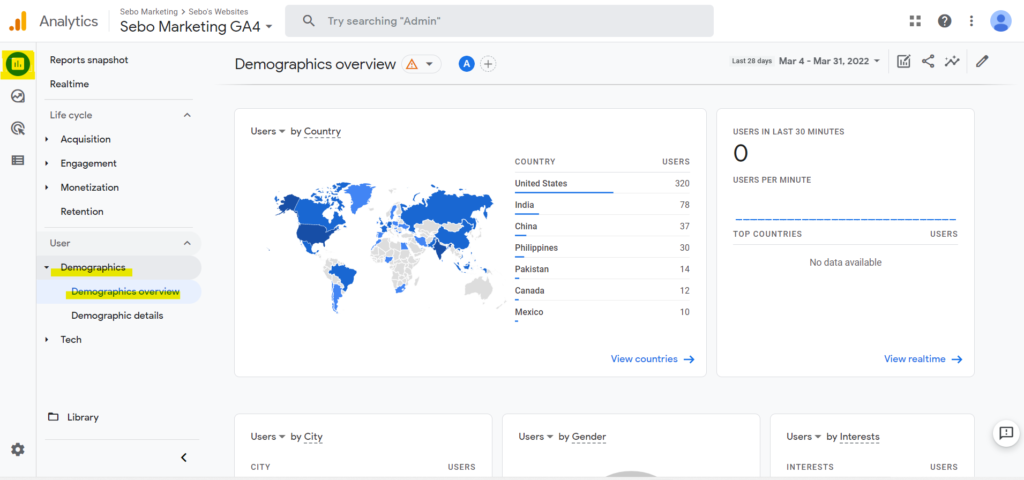
The demographics report shows us the following data for users that visited the website. It’s interesting information that we can sometimes use in our marketing efforts when trying to target the correct audience.
- Country
- City
- Gender
- Interests
- Age
- Language
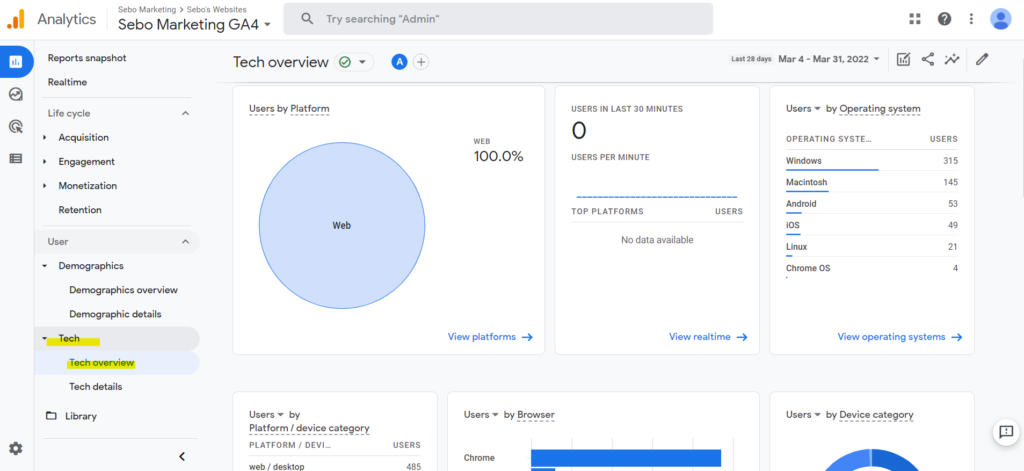
The tech report gives us the following data on website visitors. When we use this data, we are generally paying most attention to Device, as this is information we can use for page optimization as well as targeting in ads. The other data points may be interesting, but aren’t as useful for the work we are doing.
- Platform (Web, IOS, Android, etc.)
- Operating System (Windows, Chrome, etc.)
- Browser (Chrome, Safari, Firefox, etc.)
- Device (Desktop Computer, Mobile Device, Tablet)
- Screen Resolution
- Etc.
Search Console gives us insights into how Google sees our clients’ websites. We mostly use Search Console for OnPage and OffPage SEO. It is an essential tool for anyone who owns a website and wants to give their users the best experience possible.
Watch the following video about Search Console and then explore some different websites in Sebo’s account.
Review various ways we can view data within Search Console. You can access Search Console by visiting search.google.com/search-console/ within Sebo’s Agency Gmail account. You can then toggle between different properties (or websites) in the upper left hand drop down.
Performance Report
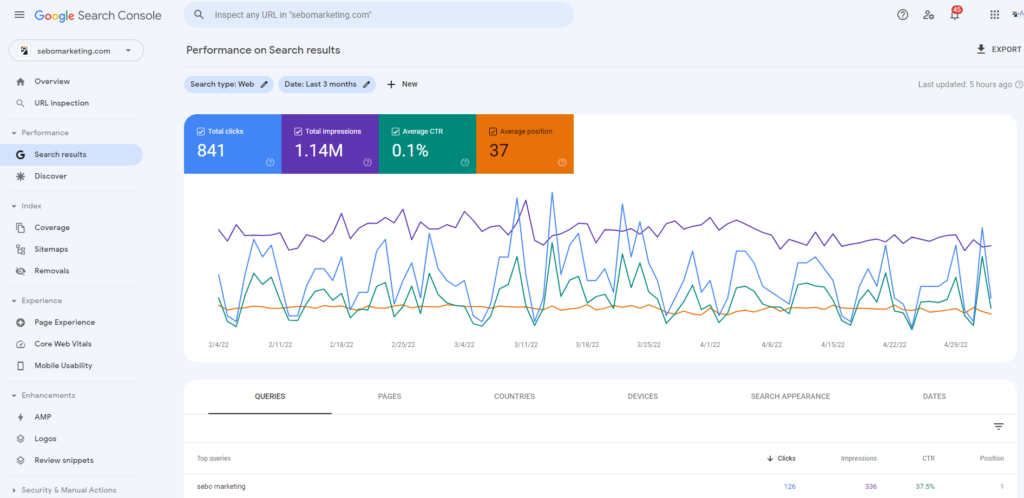
The performance report is one of the most valuable reports we use Search Console for. In it we can see what queries our clients’ websites show up for when someone searches on Google. Search Console shows us the queries that triggered a website to show up in an Organic Google Search.
- Query: the search phrases a website shows up for on Google
- Impressions: How often someone saw a link to your site on Google. Depending on the result type, the link might need to be scrolled or expanded into view.
- Clicks: How often someone clicked a link from Google to your site.
- (average) Position: A relative ranking of the position of your link on Google, where 1 is the topmost position, 2 is the next position, and so on.
- Click-through rate: The calculation of (clicks ÷ impressions).
Get familiar & comfortable with viewing this section of Search Console.
*In some properties, this is found under Performance >> Search Results, in other properties the section is just called Performance.
Below are some other ways to view different data within Search Console. Practice viewing the following reports within Search Console and try to think about how these might be useful for digital marketing.
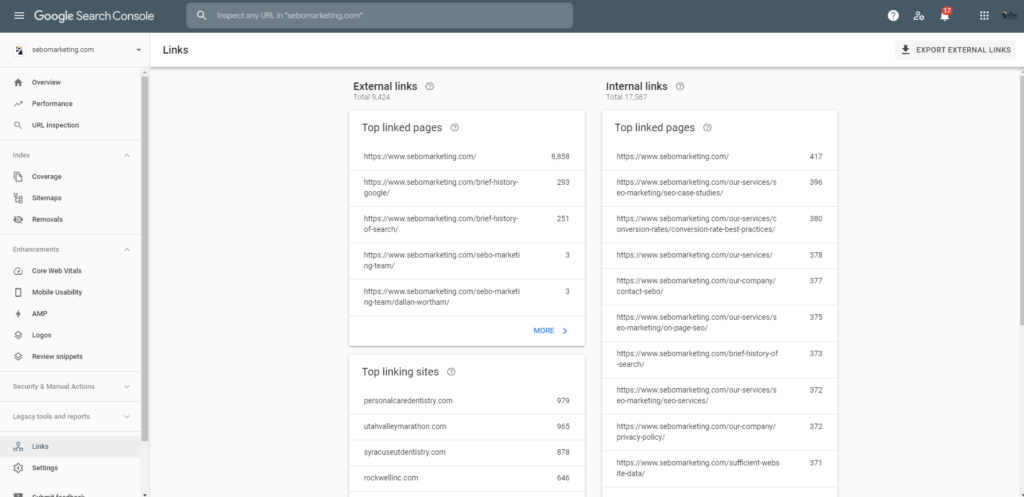
Links to Your Site & Internal Links
External Links: Google shows us what other websites link to a website.
Internal Links: Google shows us which pages have the most internal links on a website.
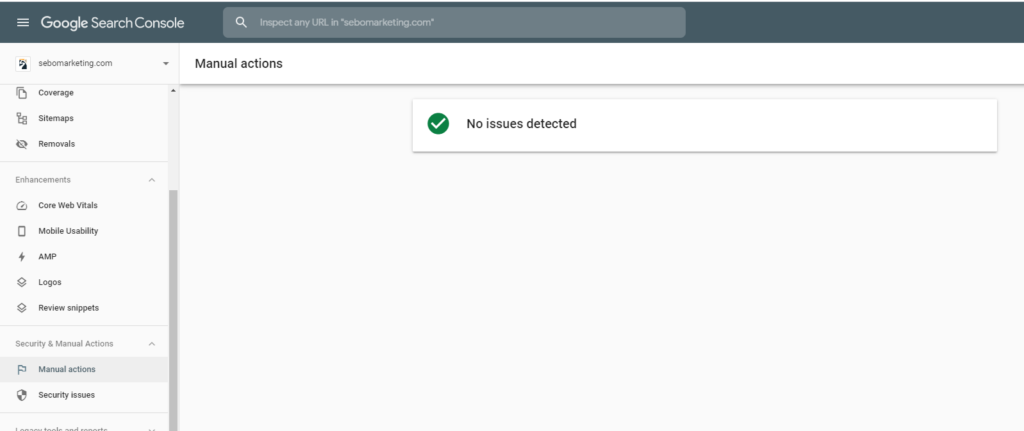
These are created by human reviewers at Google, not crawlers and bots. Manual actions are most often used to tell us when Google believes we are trying to manipulate their algorithm in an unacceptable way (see Black Hat SEO).
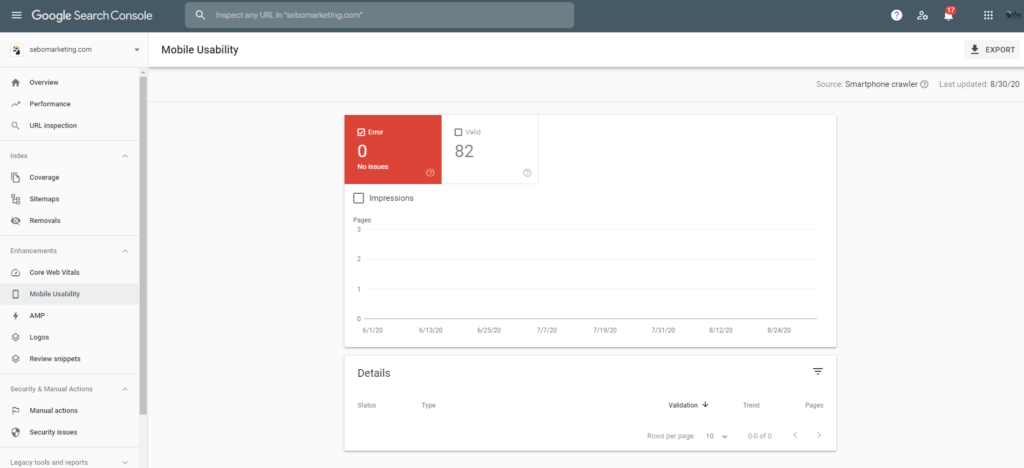
Google wants to make their users happy. A majority of people access the web through their phones, so Google helps us know when a page is not mobile friendly and what needs to be fixed.
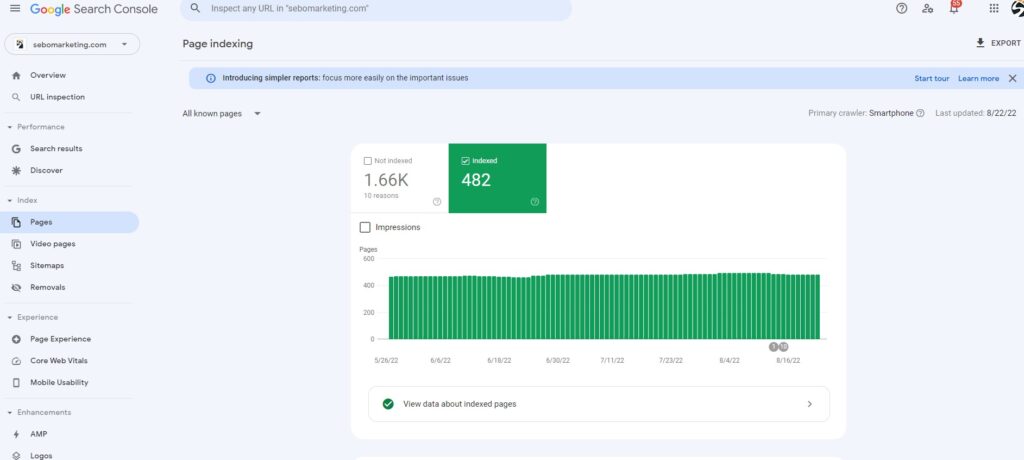
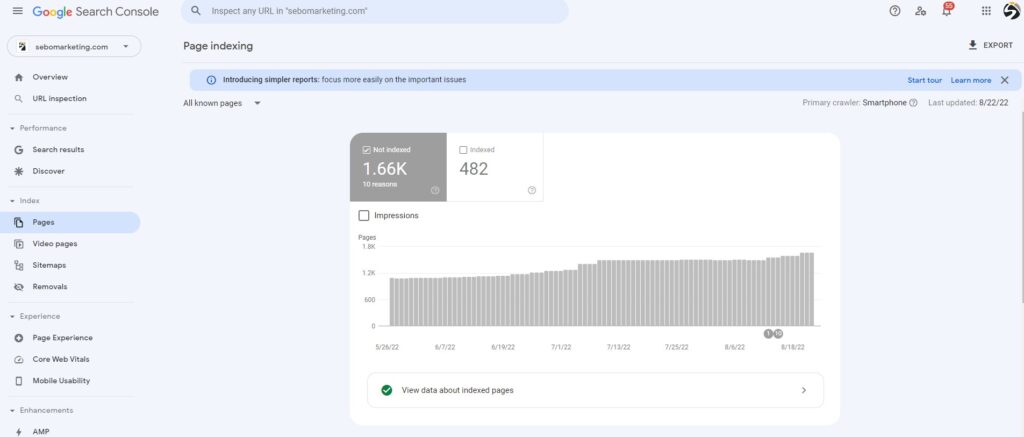
This is the number of pages Google has indexed of the website. These pages are eligible to show in organic search results.
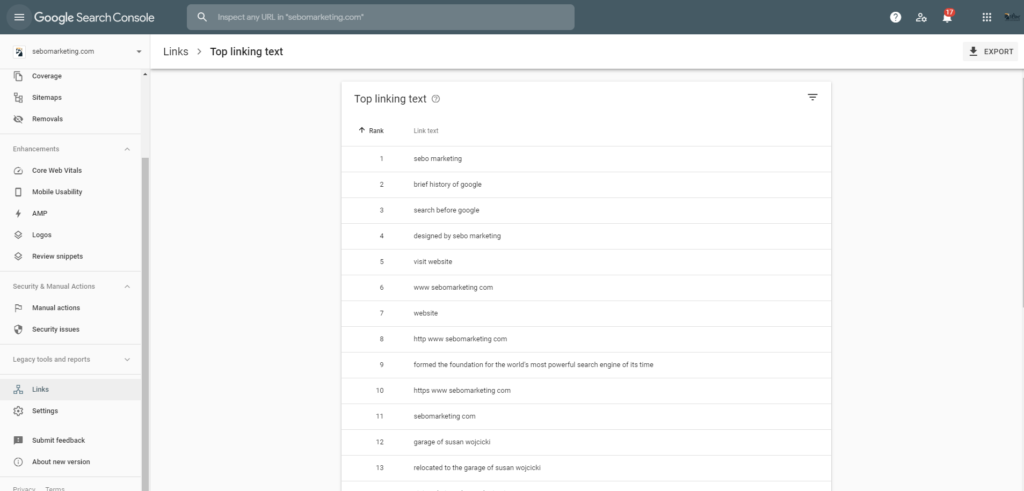
More often referred to as Anchor Text, Google defines linking text as “the text that appears highlighted in a hypertext link and that can be clicked to open the target web page.”
This sections tells us if Google is running into any problems when trying to index a page. Usually these will be things like 404 errors due to a page that no longer exists. Sometimes we don’t want pages to be indexed, but other times these are likely errors that need to be investigated – for example, we would want to investigate the highlighted issues in the second image above.
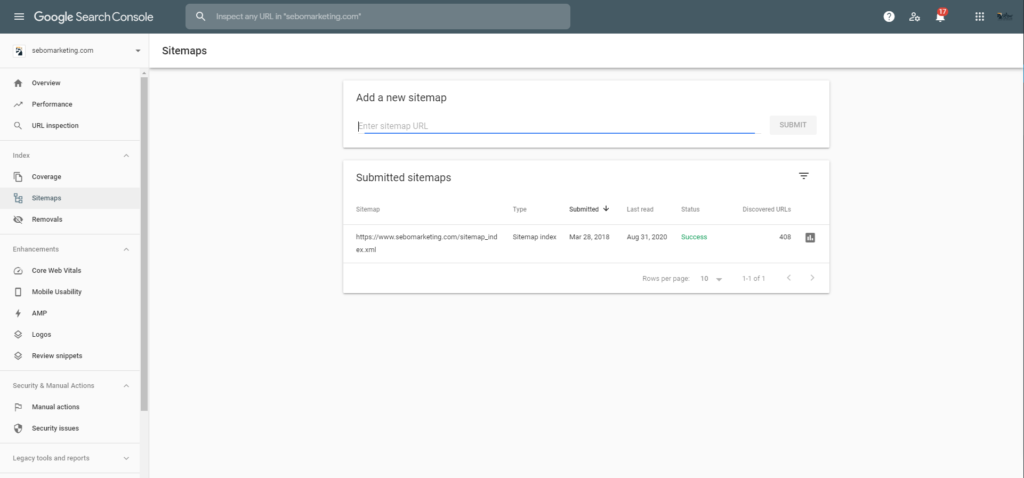
Sitemaps are files we upload to Search Console to tell Google all the pages we want to have indexed.
We use Google Tag Manager (GTM) to track specific actions within Google Analytics. This is how we set up Goals and Events within Google Analytics. The video below will explain it more in depth, but for now you will not be required to understand much about GTM.
Using Google Tag Manager to Simplify Tag Implementation
(In Sebo’s Words)
Google Tag Manager was created in order to make the process of implementing tracking on various platforms more simple. Before Tag Manager, a webmaster or agency would have to have access to the backend of the website, go into the header or footer code, and implement each tag separately. This leads to multiple people needing to sign into the backend of the website constantly, which is a security issue, and messy backend code. With Tag Manager, these two issues are resolved.
By implementing Tag Manager once, a user can then implement any other tracking code through Google Tag Manager without having to sign into the backend of the website. Below is an image of the GTM (Google Tag Manager) code that is implemented in the backend of the site. It is the only tracking code that should need to be implemented.
If a website has a link to another website, we can’t track those clicks because we won’t have our tracking code on the 3rd party website. The same goes for 3rd party embedded elements on the website such as YouTube videos. Google Tag Manager is a tool that makes that tracking possible. It can be used to create events for tracing important clicks to other websites or people watching the videos on your site. There are several other uses for Google Tag Manger, but these are some of the most common ones you will see.
Tags, Triggers, & Variables
Variables, triggers, and tags are the ways we utilize GTM. Using these, we can track video clicks, phone calls, and implement Analytics.
Tags and Triggers
A tag is a snippet of code that executes on a page. Tags can serve a variety of uses, but most of the tags used in Google Tag Manager are designed to send information from your site to a third party. Examples include the Google Analytics tag and the AdWords Conversion Tracking tag, which send information about activity on your site to Google.
If you don’t use a tag management solution such as Google Tag Manager, you add the code for each of your tags directly to the source code of your site. With Google Tag Manager, you can instead control all of your tags conveniently from a web user interface.
Tags typically execute, or fire, when the page loads, or in response to some interaction on the page. In Google Tag Manager, you define triggers with tags to specify when they should fire. An example of a trigger is the predefined “All pages”, which as the name implies may be used to set your tag to fire on any page on your site as it is loaded.
Triggers and Variables
A trigger is a condition that evaluates to either true or false at runtime. It does this by comparing the value in a variable with the value that you specified when you defined the trigger.
A Tag Manager variable is a configured name-value pair for which the value is populated during runtime. Tag Manager has many built-in variables, and you may configure custom variables as well.
For example, the predefined variable “url” always contains the URL of the currently loaded page. If you want a tag to fire only on the page example.com/purchase/receipt.html, you would define a trigger that looks like this:
- Event: Page View
- Trigger Type: Page View
- Fire On: Some Page Views
- Fire the tag when these conditions are true:
URL contains example.com/purchase/receipt.html
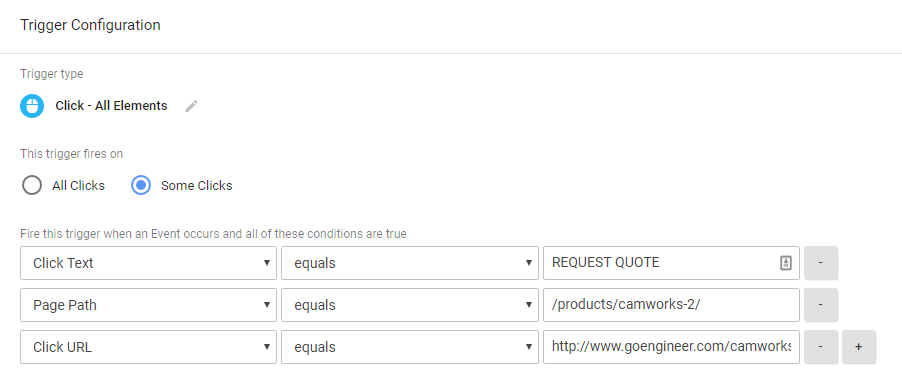
You can define variables to suit your needs, each containing some piece of information that needs to be available at runtime. You can then use these variables in trigger conditions, or to pass information to tags. For example, you might define a variable that contains the price of an item that the user is viewing. Or, you might define a variable to contain a constant value such as your Google Analytics account id string. Below is an example of a trigger and the different variables that fire that trigger:
Event and Conversion Tracking
One of the main things we use GTM to track is events. Events refer to any action taken by a user on a website that isn’t a conversion. We may also call these micro conversions. “Micro” because unlike a “macro” conversion, they don’t directly add value to a website visit. Common events may be watching a video, clicking on a social page link, clicking a link to a contact us page, or any number of actions a visitor may take that makes them more likely to perform a macro conversion. Events only apply to Analytics tracking since Analytics is the only platform that directly tracks them.
Most of the time, conversions are tracked by creating a destination goal within Analytics. When creating a destination goal, GTM is only necessary for implementing the Analytics tracking code; however, if there is an action on a site that should be tracked as a goal, but doesn’t work as a destination page, you will need to create an event goal. Simply stated, an event goal is an action that needs to be tracked as an event, but is then used to trigger a goal. For example, let’s say a client provides other websites with traffic through links. This client’s website’s purpose is to have visitors click on a link and leave to another website. We can’t track that as a destination goal because the destination is a separate domain. So, in order to track this as a goal, we create an event, then within Analytics, we create an Event Goal.


