Last Updated on May 8, 2023
One of the main tools we use for tracking data is Google Analytics. It is essential you become familiar with Google Analytics accounts.
Watch the video below and then explore the Sebo Google Analytics GA4 account. Review different ways we can view analytics data. Below are some ways we regularly view data within Analytics, practice viewing the data in each of these ways.
For more in depth questions on Google Analytics 4: Get started with the new Google Analytics
Google Analytics: The What, The Why, The How
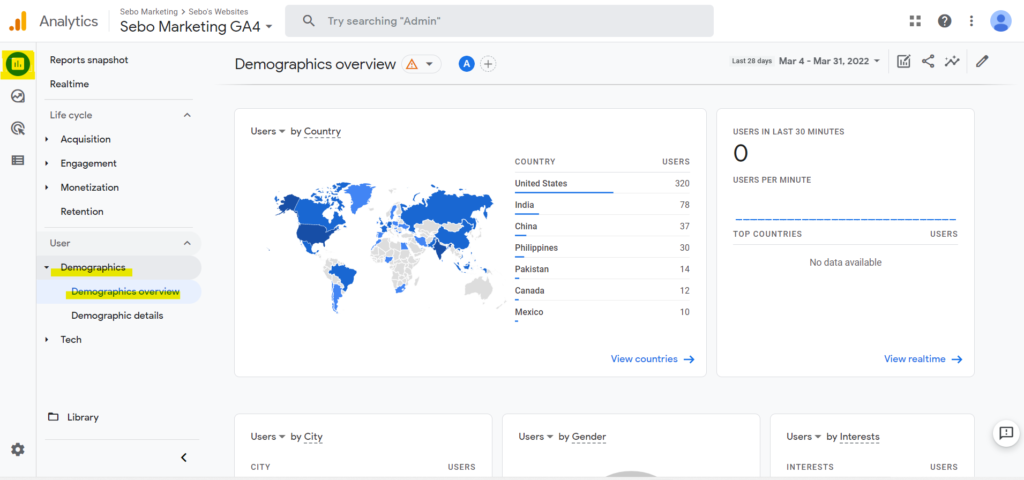
View Demographics Data
- Country
- City
- Gender
- Interests
- Age
- Language
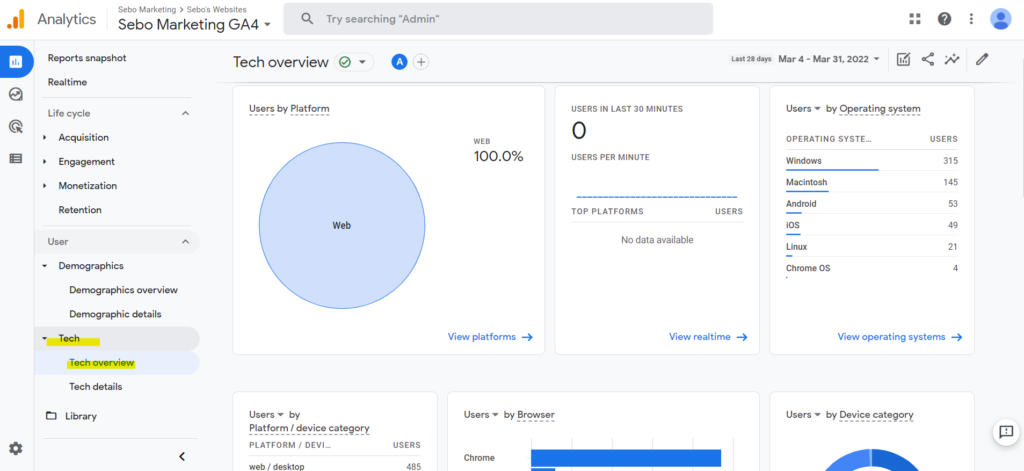
View Tech Data
- Platform
- Operating System
- Browser
- Device
- Screen Resolution
- Etc.
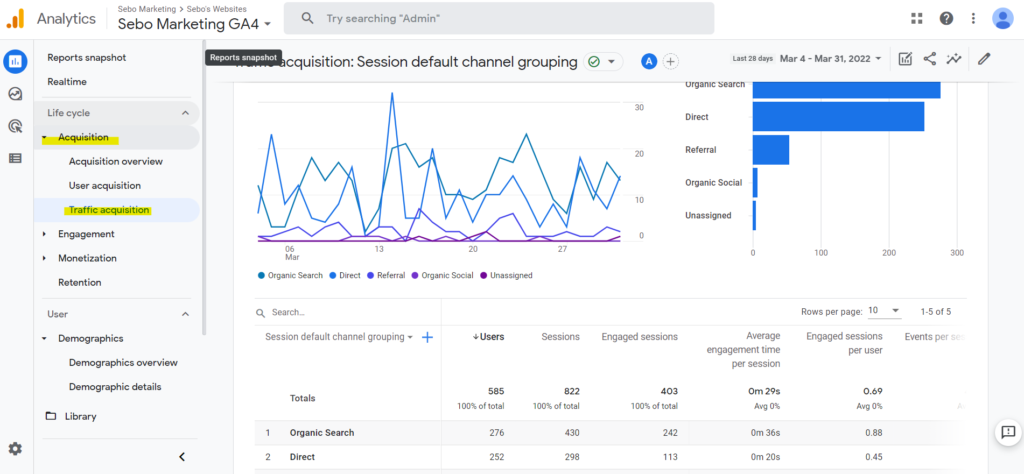
The Traffic Acquisition Report – View Analytics Data by Channels
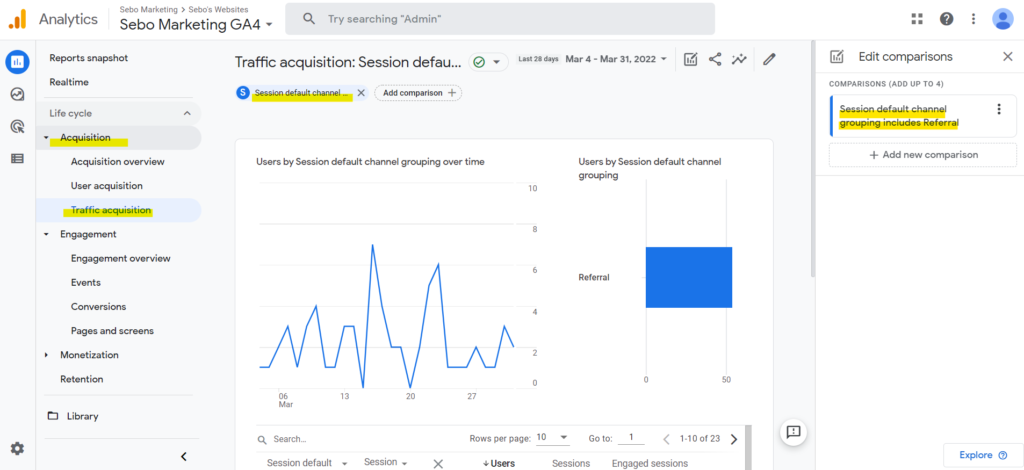
From the Admin Page Click on Reports (the 2nd icon down in the left menu) -> Life Cycle -> Acquisition -> Traffic Acquisition
Important Columns
Users and Sessions: sessions represent the number of individual sessions initiated by all the users to your site.
Engaged Sessions: The number of sessions that lasted longer than 10 seconds, or had a conversion event, or had 2 or more screen or page views.
Engagement Rate: Engaged Sessions/Sessions
Event Count: Events include conversions, but also include less significant actions like page views
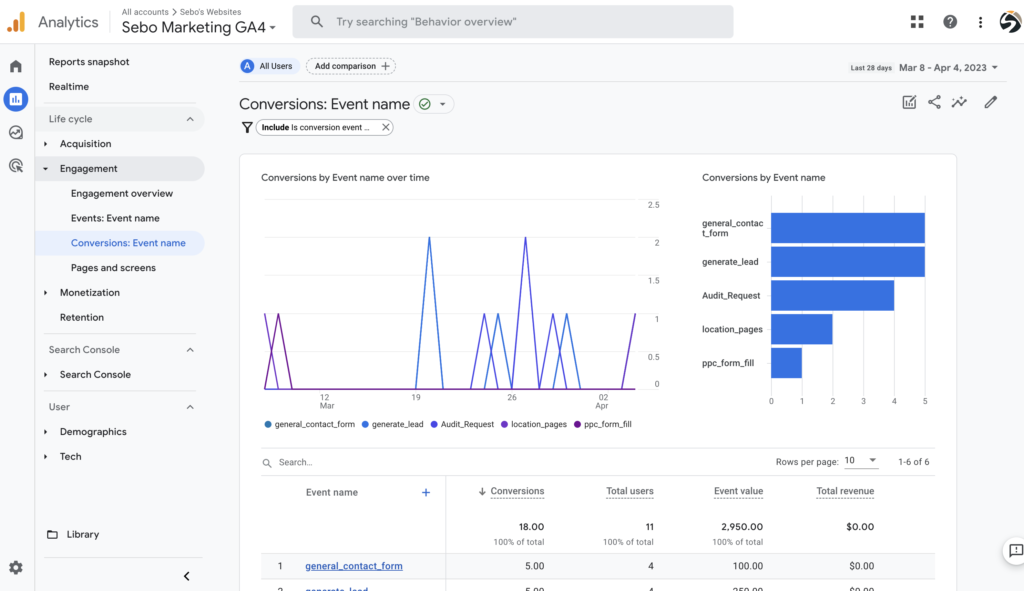
Conversions: These count the conversions that you have set in your account
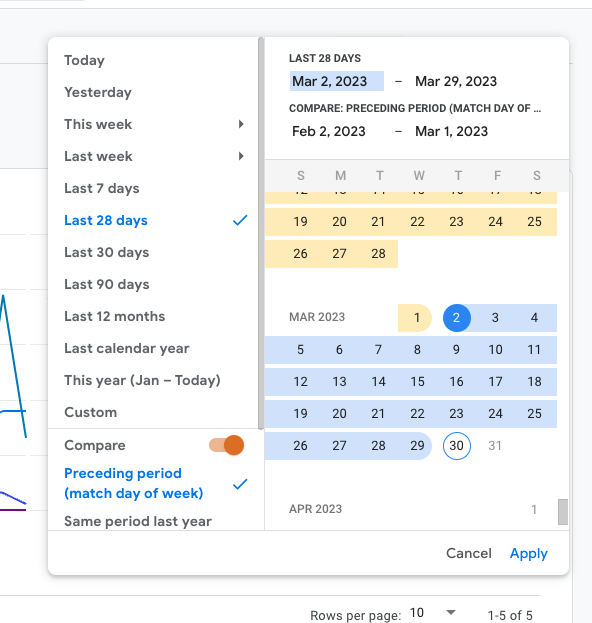
One common mistake many people make is that they forget to change the date range. You can change it using the drop down in the top right hand corner of the page. You can also toggle the “Compare” toggle to compare two different date ranges.
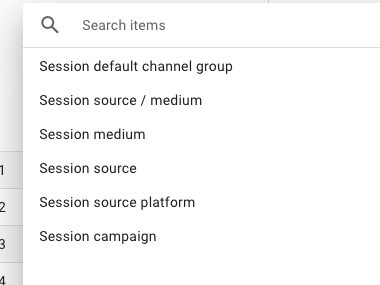
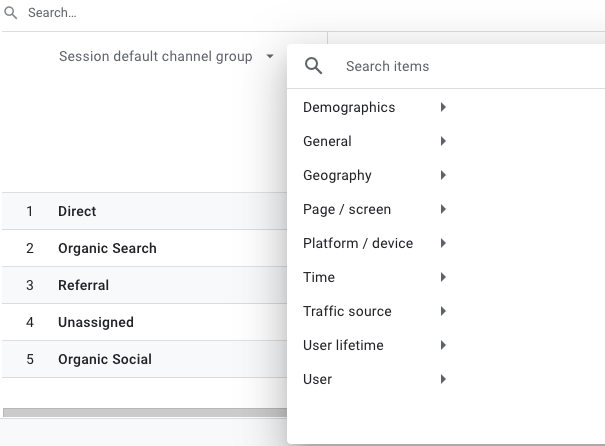
By clicking on the “session default channel group” dropdown you can sort the data by other groups:
Session default channel group: the basic channels
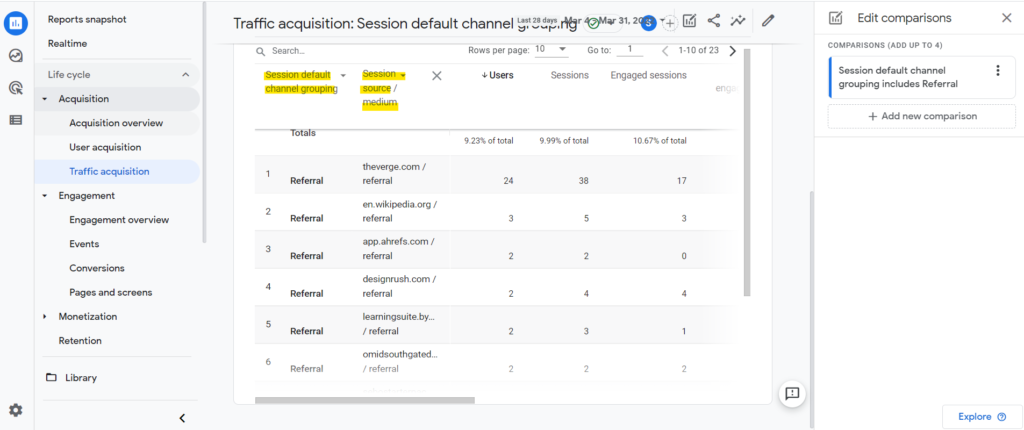
Session source/medium: the source and the channel
Session source: where the user came from
Session source platform: which platform did the user come from like Google Ads or Socials
Session campaign: Which advertising campaign brought the user (from Google Ads or other digital marketing campaigns)
You can filter data by clicking on the plus sign at the top of the page next to the Traffic Acquisition title.
You can segment the data by several categories like demographics or device clicking on the plus sign next to the “session default channel group” drop down.
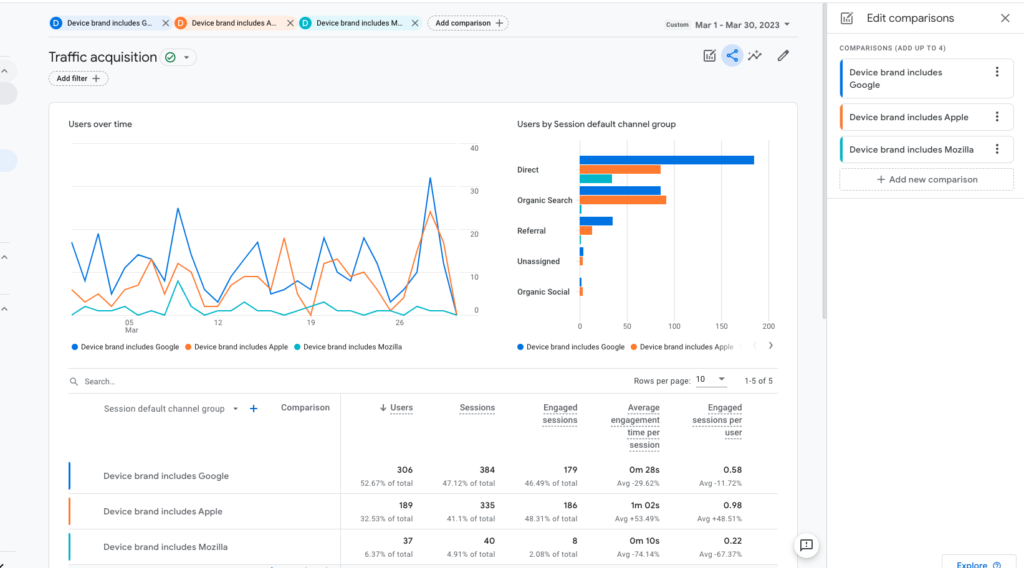
In the top left side you will see a + sign with the text “Add comparison” next to it. This is how you can build comparisons across different dimensions in the traffic report.
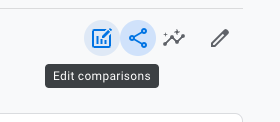
In the top right corner you will see an icon that says “edit comparisons” when you hover over it. Use this tool to compare user segments.
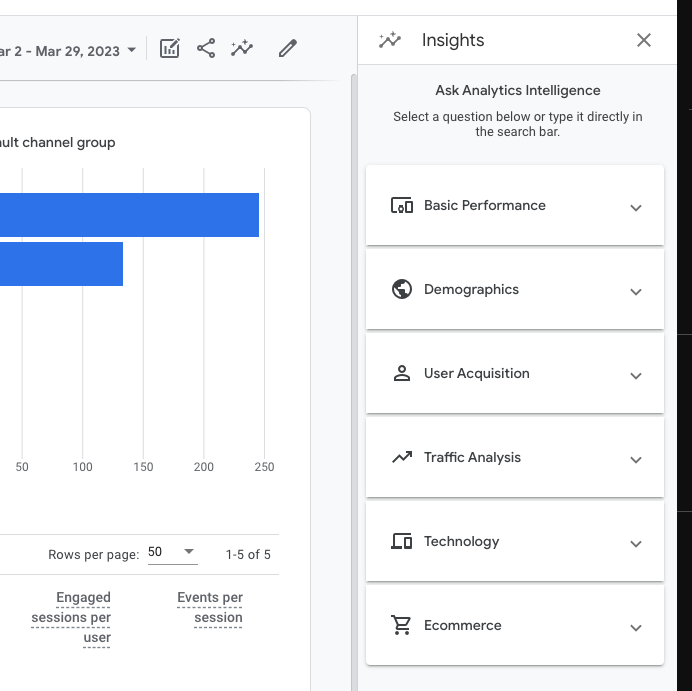
If you click on the insights icon on the top right you can see answers to commonly asked data questions.
You can download the report by clicking on the share icon in the top right corner.
View The List of Referral Websites
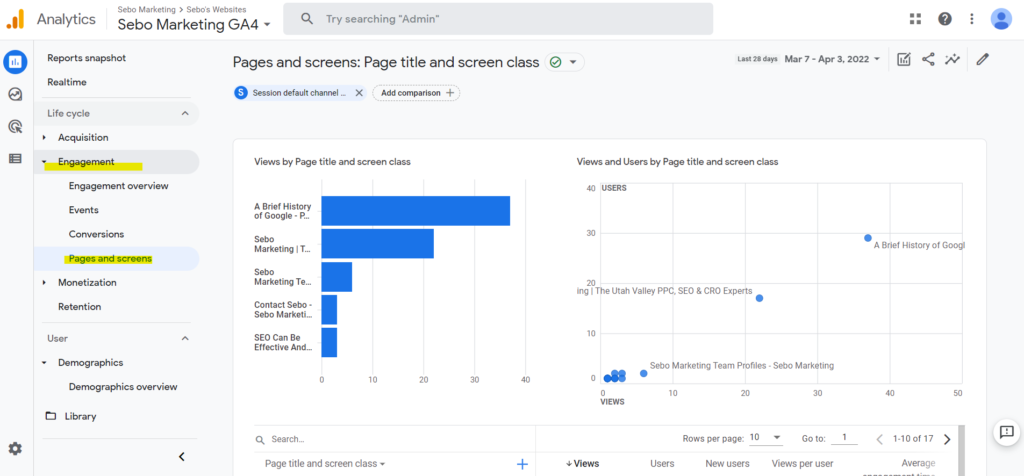
View the List of the Most Visited Pages on a Website
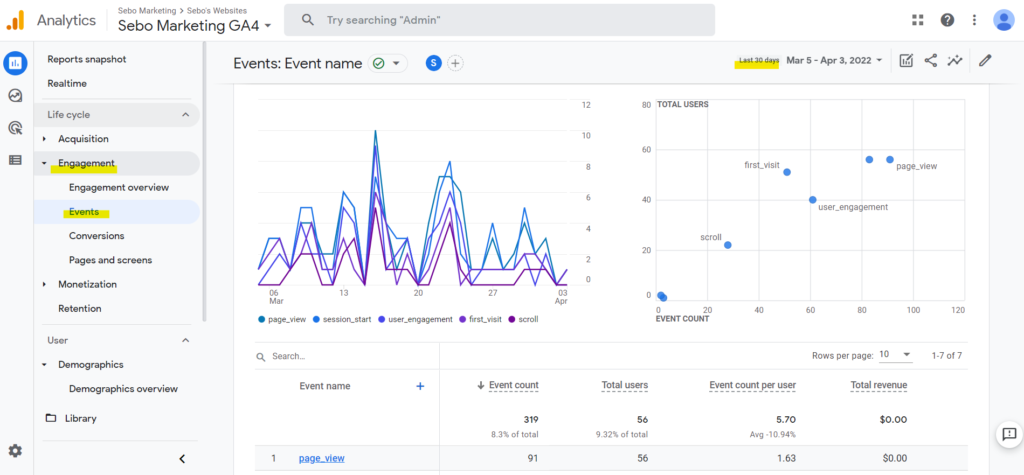
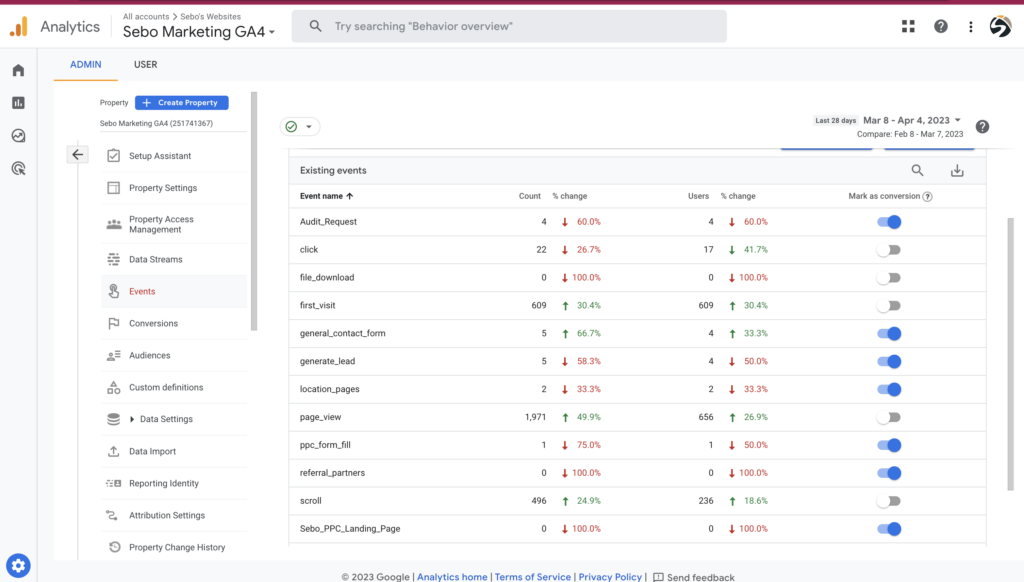
View the Number of Website Events That Have Taken Place in the Last 30 Days
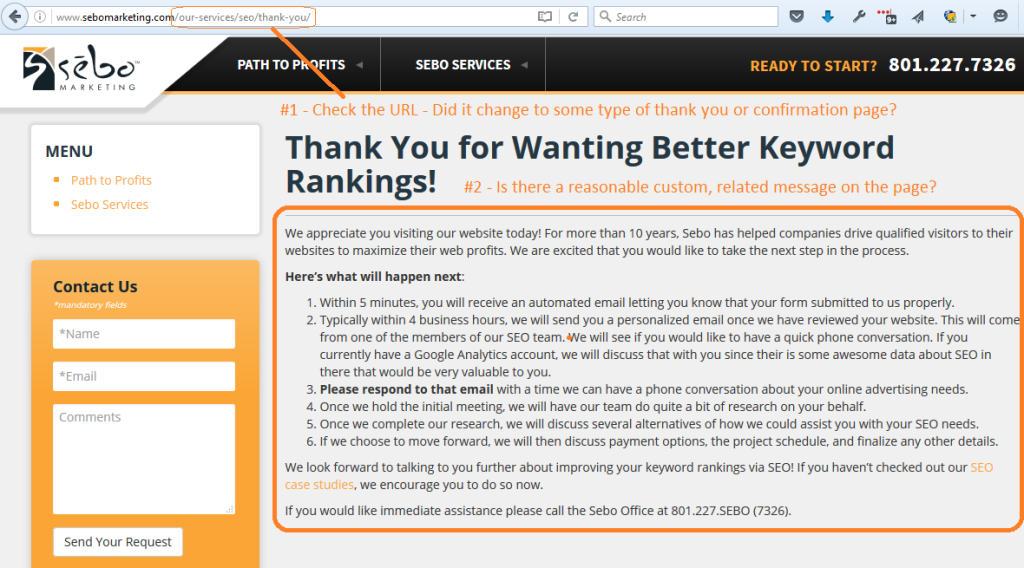
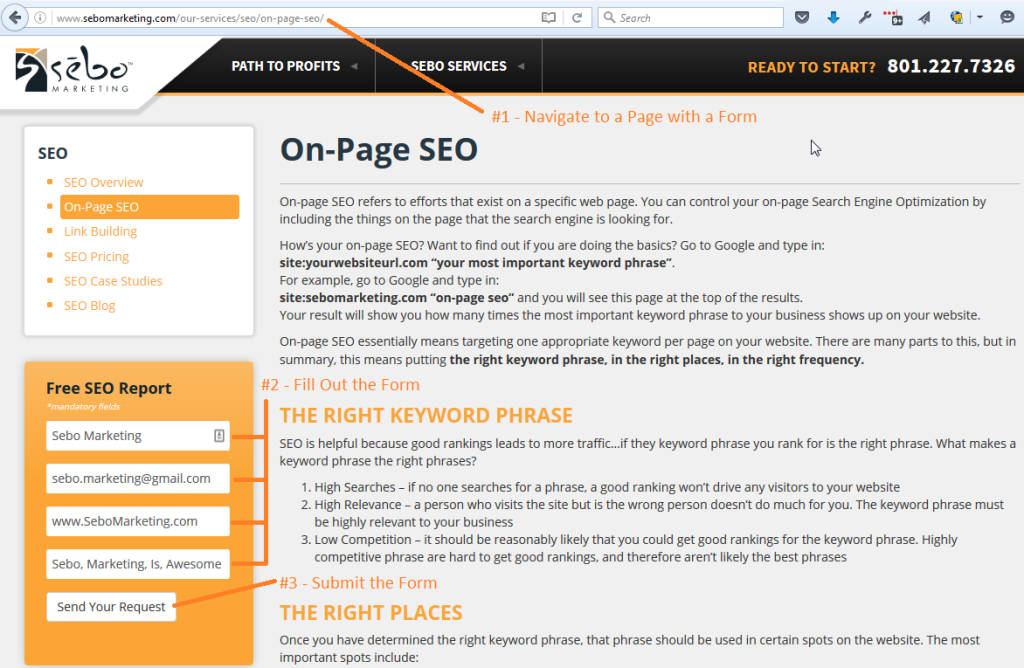
Test a Form on a Website to Ensure Goals Can be Set Up Properly
Forms should always redirect you to a thank you page to ensure accurate conversion tracking. The best way to test this is by filling out a form on a website.
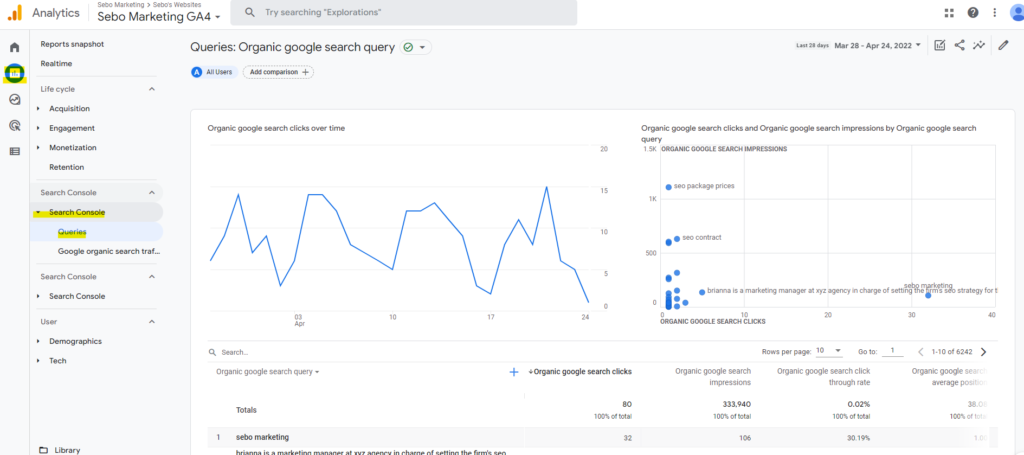
View Search Console Data
By connecting Search Console to Google Analytics, we can see organic traffic website data based on the keyword that was searched on Google.

