Each of the main report categories in GA4 (acquisition, engagement, monetization, retention, demographics, and tech) contain an “overview” report with various cards that show a short summary of the data about that category. For example, the engagement overview report includes “Event count by Event name” and “User activity over time” cards, and the tech overview contains “Users by Platform” and “Users by Device category” cards, among others, by default. Each overview report contains between 6 and 11 summary cards by default, but can be customized by clicking the pencil icon in the upper right corner of any report to include up to 16 cards, depending on what data is important to a particular business.
Last Updated on April 11, 2023
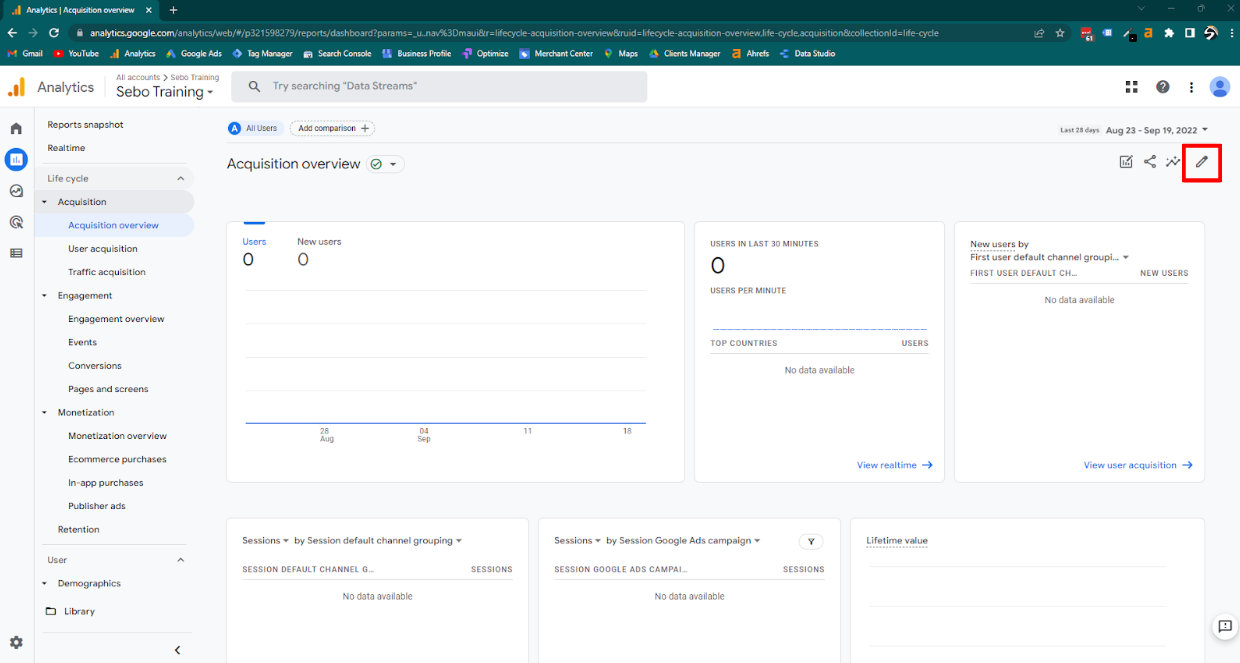
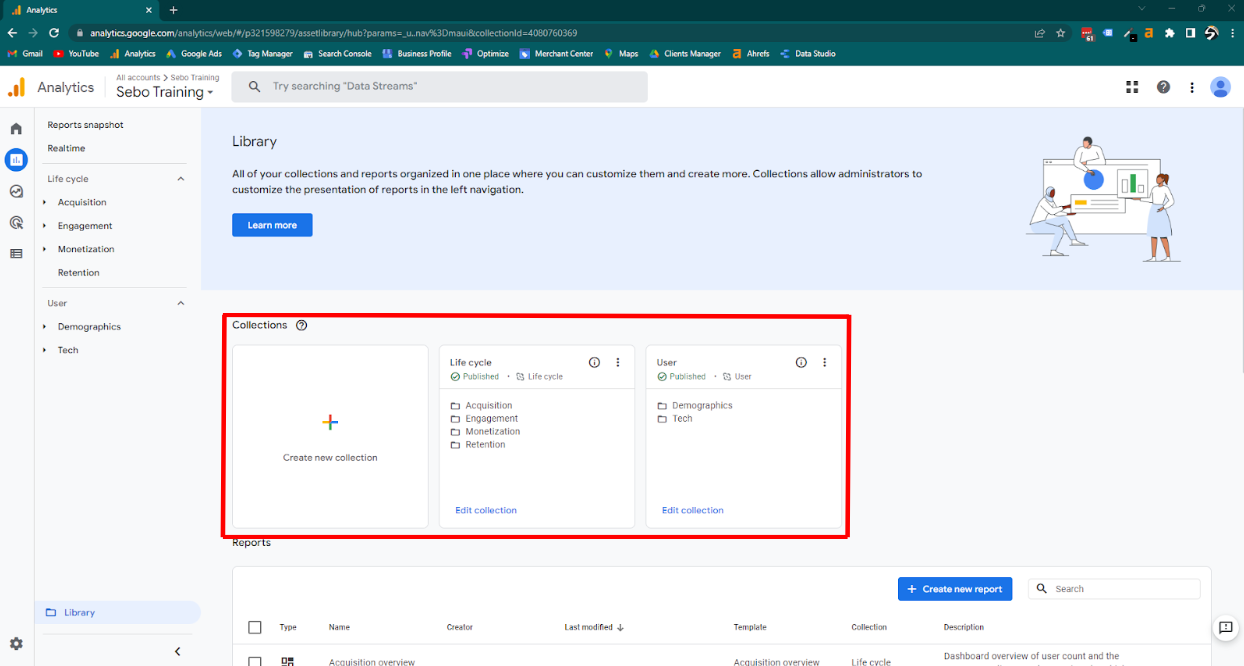
Additionally, by going into the “library” section of the “reports” screen, new overview reports (and detailed reports) can be created from scratch that don’t fit into any of the categories listed above. In order for a newly created report to show up in the navigation bar, it will need to be included in either a pre-existing collection (ex. “Life cycle” or “User”) or a new collection. Once a new overview report has been created, it can also be set as the “Reports snapshot” which is the default report shown when first accessing the “Reports” tab.
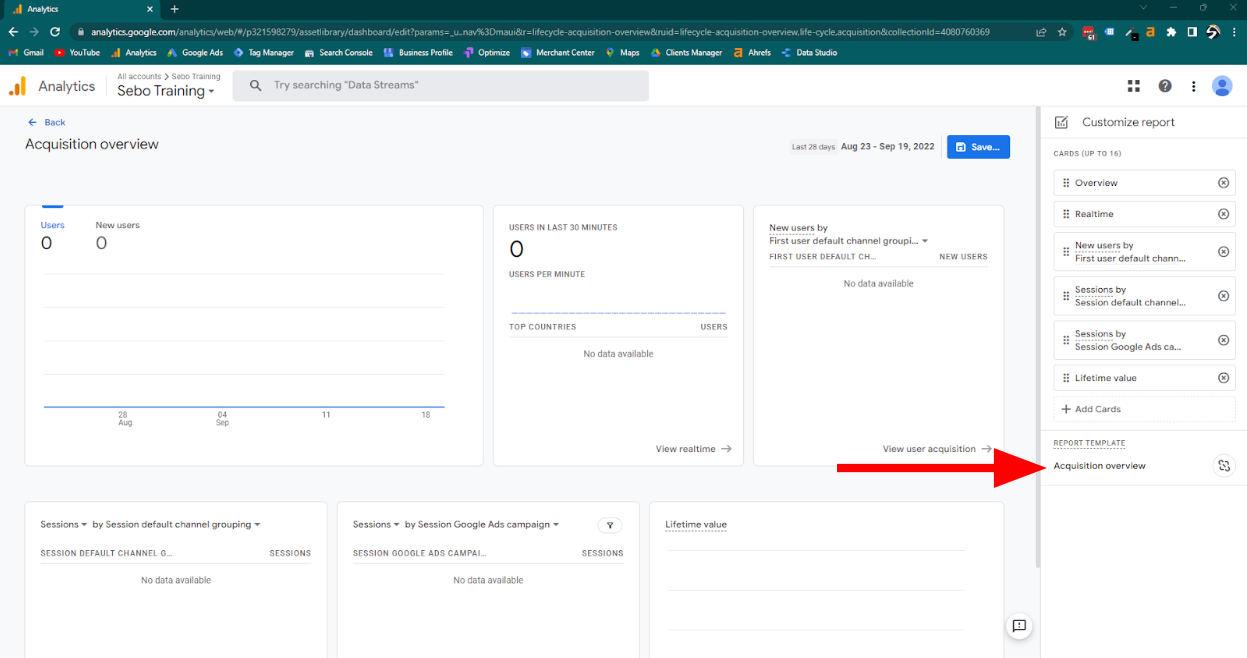
It is important to note that collections and reports can either be “linked” or “unlinked”. If they are linked, then they are able to be automatically updated by Google. For example, if any given report has a new card added to it or edited by Google, the report will match those changes. If a report was created using a template (such as by editing or making a copy of one of the pre-existing reports) it will be automatically linked. Accounts made from scratch, however, are not linked and will not receive any updates from Google. You can know if your report is linked by looking in the report editor to see if there is a template it is linked to
GA4 Explorations
GA4 allows you to create data studio style reports to better visualize data and better understand the behavior of visitors to a website. Once an exploration has been created, they can be shared with other people who also have access to the Analytics property. Explorations have many similarities to Reports, but one major difference is that Explorations help you analyze data and they also give access to some data that isn’t available in Reports. One of the most useful things about Explorations is that they allow you to quickly gain insight about and perform queries on a large data set.
Although Explorations and Reports display the same data most of the time, slight differences in data processing can lead to discrepancies. Some of these differences are described below:
- Granularity and field support: Due to the ways that Explorations and Reports can show you data, the granularity is often different. There are also some metrics and dimensions that are supported in Reports, but not in Explorations. If you include these unsupported fields in an Exploration, trying to access the Report will result in missing areas, such as charts or other visualizations that don’t appear. Similarly, if you try to use a comparison in a Report that isn’t supported in an Exploration, those comparisons will automatically be converted to segments, which can change the data that is included in the Exploration
- Date range/retention: Explorations can only include data that was collected during the timeframe allowed by your property’s data retention window.
- Large data sets: Sometimes a sample of the data set is used if the set is too large. Analytics tries to make it as representative of the whole as possible, but it can’t be completely accurate. It is possible to request unsampled results, but you can only request a limited number per day and the results will only be available to view for 50 days
- Processing time: Analytics gathers data from various sources and not all the data is imported or processed at the same time. Any queries that are run over a period that covers the last 48 hours will likely not be completely accurate
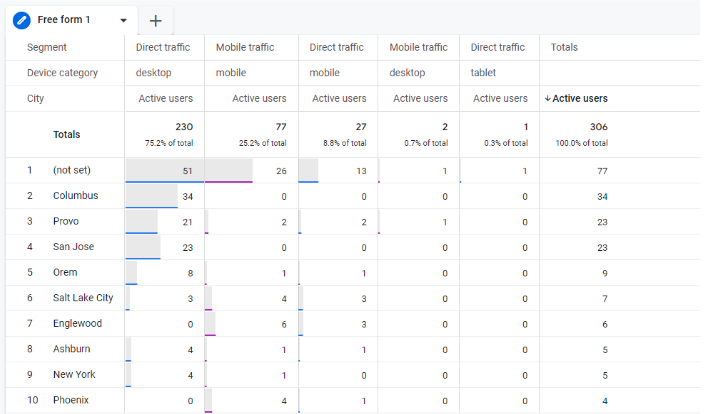
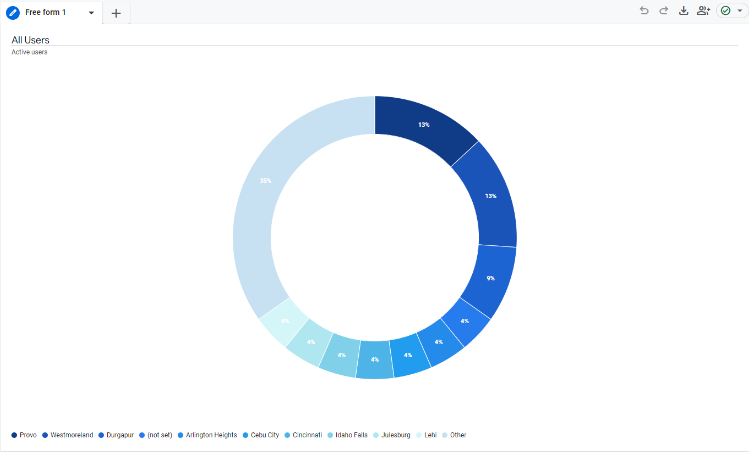
- Free-form: This kind of exploration lets you organize your data into a table or graph, compare multiple metrics at once, segment and filter your data, and create new segments and audiences. Free-form explorations can also detect anomalies in your data by defining a model and using a line chart to find outliers. These explorations are the most customizable of all the techniques and give the most variety in the kinds of visualizations you can create
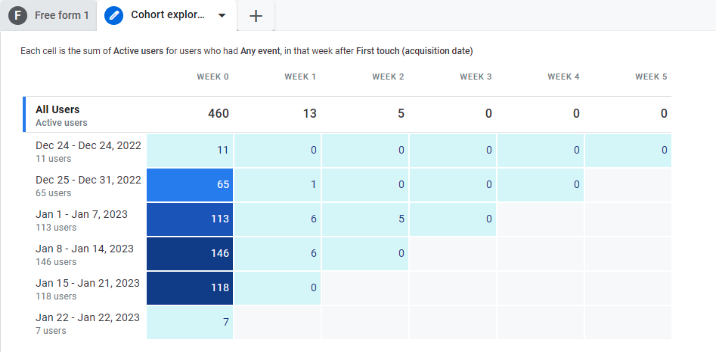
Cohort: Separate data by users who fall into the same category. Examples of categories include acquisition date, users who perform a certain action or conversion event, etc. You can then see how this group of users as a whole progresses over time by setting return criteria (usually the same categories as before) and granularity (how long someone remains in a cohort, either by day, week, or month). You can then perform various kinds of calculations on the data shown, depending on whether you want to include users who have previously been included in the cohort or only the current users
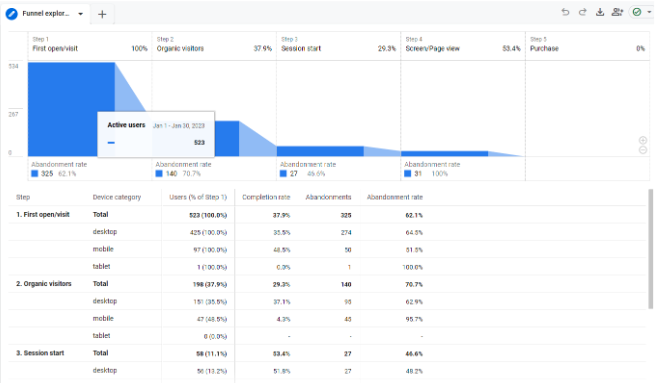
Funnel: These explorations let you see what actions users take to complete a certain task/conversion event and if they are continuing through the funnel or exiting at any point. A funnel can be set as either open, meaning a user can enter the funnel at any point, or closed, meaning they have to complete the first step in order to enter the funnel. You can edit which steps are included in the funnel and if they have to be directly or indirectly followed by another step in order for the user to continue through. A checkout funnel can be especially helpful for ecommerce to see if people are completing the purchase process
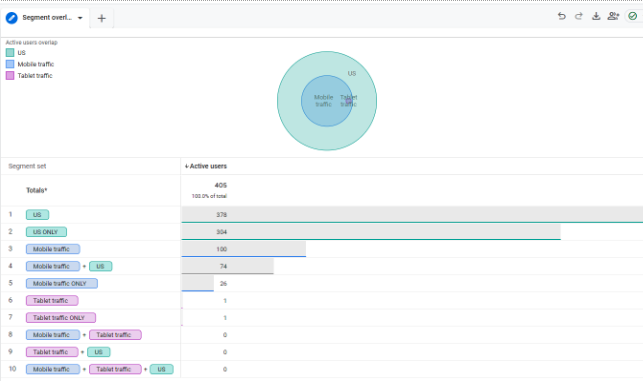
Segment overlap: This technique can be used to see how up to three different segments compare to each other. If there is any overlap, you can then determine who fits into a newer, more complex category of users which can make other techniques and reports more detailed. Filters can also be added to these reports to further refine your data
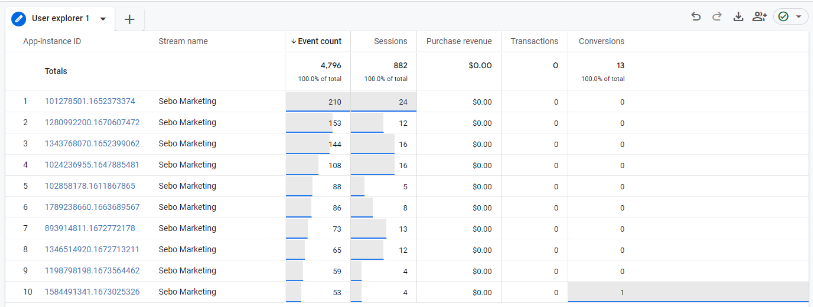
User: User explorations allow you to see the behavior of a particular subgroup of users, as well as each user’s activity on your site. This can be helpful if you notice users who stand out from the rest, for example if they got stuck while placing an order, so you can help improve each individual user’s experience
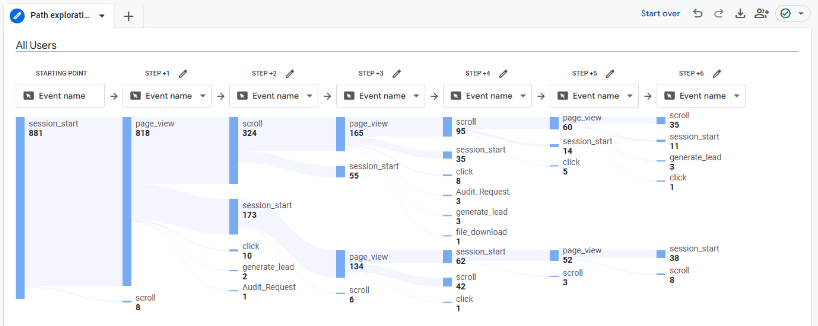
Path: Some of the purposes of a path exploration include seeing which pages users visit first after the home page, what actions are taken by users, what effects an event has on subsequent user behavior, and discovering any loops (users getting stuck). You can either choose to begin at a certain event and see user behavior from there, or you can choose an end goal (like a conversion) and work backwards to see how people got there. You can customize the nodes (data points) that are included in the Exploration (for example, if you don’t care about the default “scroll” event included in GA4, you can exclude it from the whole Exploration or from a specific step)
User lifetime: This technique shows you user behavior over their entire lifetime as a customer. The main insights that can be gained from this kind of explorations are what source, medium, or campaign resulted in the most revenue, which campaigns are acquiring users that are more likely to convert, and other user-based insights. The date range for this technique will pull the lifetime data for anyone who used the site within that range, even if the data comes from outside of the range.

In addition to the above techniques, you can create a new exploration from scratch. Each of the types of explorations are customizable, so you can change the “segments”, “dimensions”, and “metrics” variables, as well as the user segment comparisons, breakdowns, values, filters, and timeframe. The default technique for a blank exploration is free-form. You can also add more tabs within the same exploration, each with their own techniques, variables, and metrics. Each exploration can have a maximum of 20 dimensions and 20 metrics.
Each user can create up to 200 explorations within a property, with up to 500 shared explorations. Only 10 segments can be applied in each exploration with up to 10 filters per tab
